
Services

Observability platform for metrics, logs, and trace dashboards.

MonitoringObservability
Deploy

What is Grafana?

Grafana is an open-source observability platform for querying, visualizing, and alerting on metrics, logs, and traces from many data sources. It supports dashboards, alerting rules, and integrations with Prometheus, Loki, Tempo, and numerous other backends. Grafana is widely used for infrastructure monitoring, application performance, and operational dashboards.
How to deploy on Kubeara

  1. Sign in to your Kubeara dashboard and connect a server if you have not already.

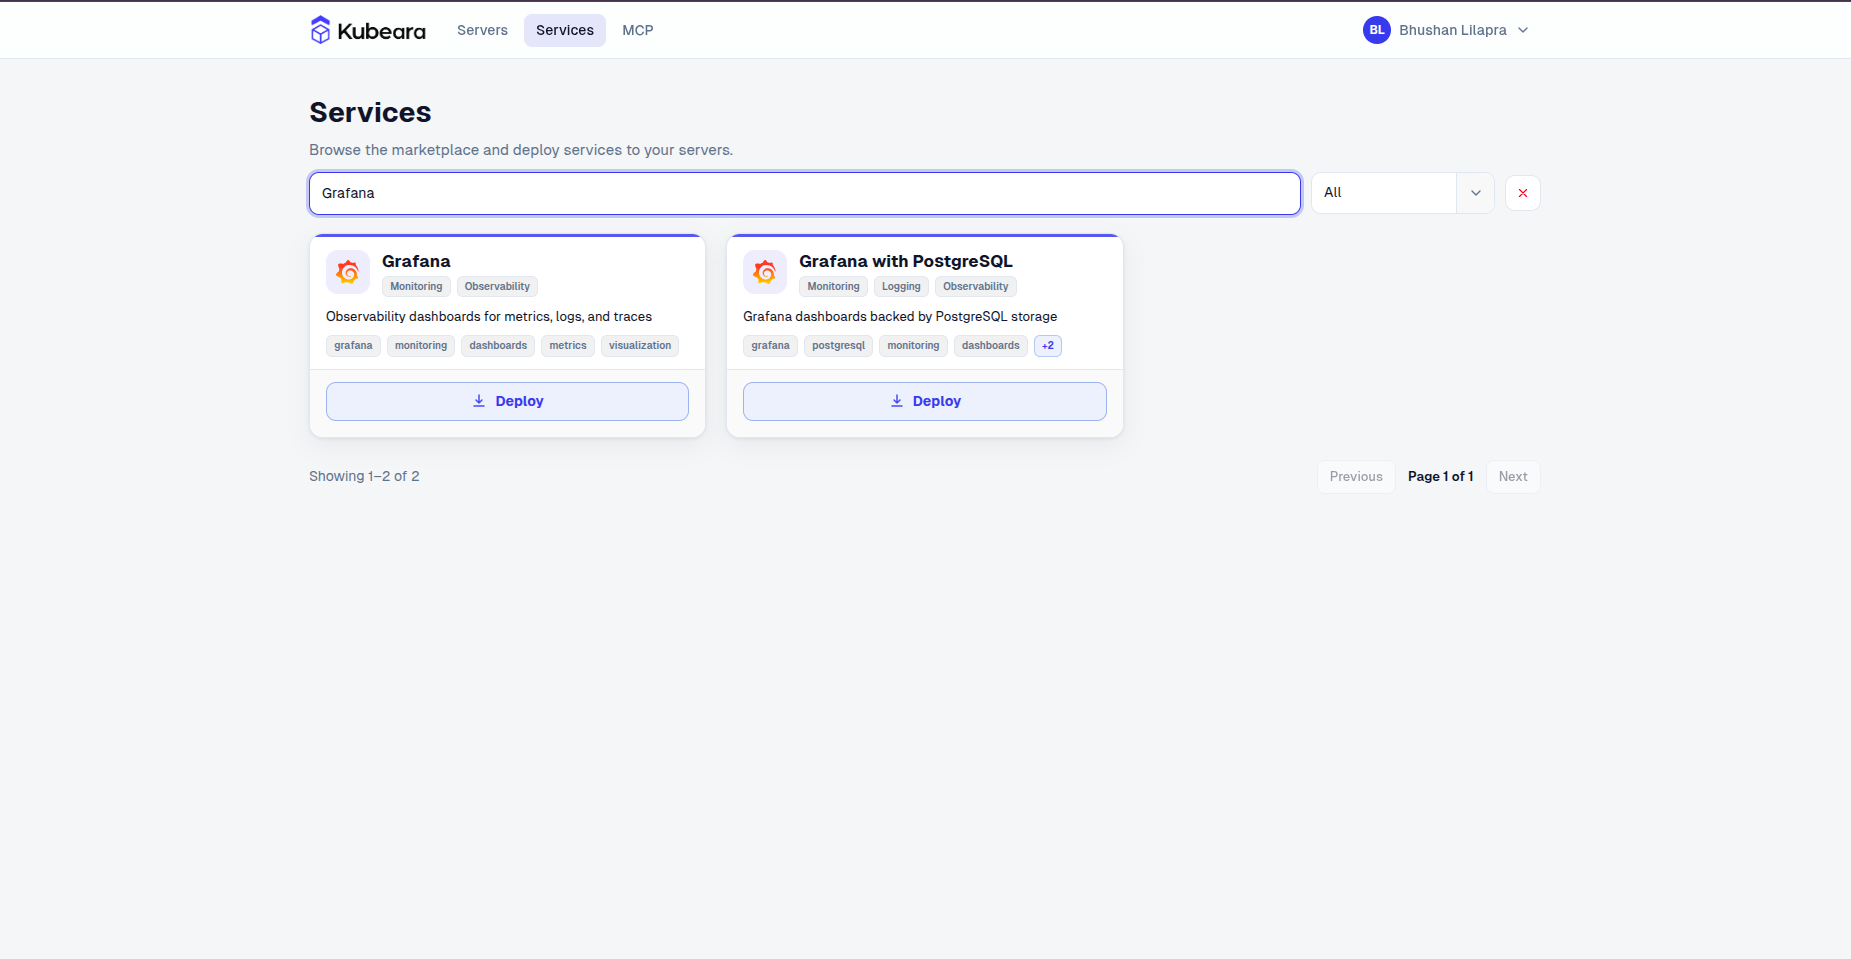
  2. Open the Services catalog and select Grafana.

    Grafana on Kubeara
    Grafana on Kubeara
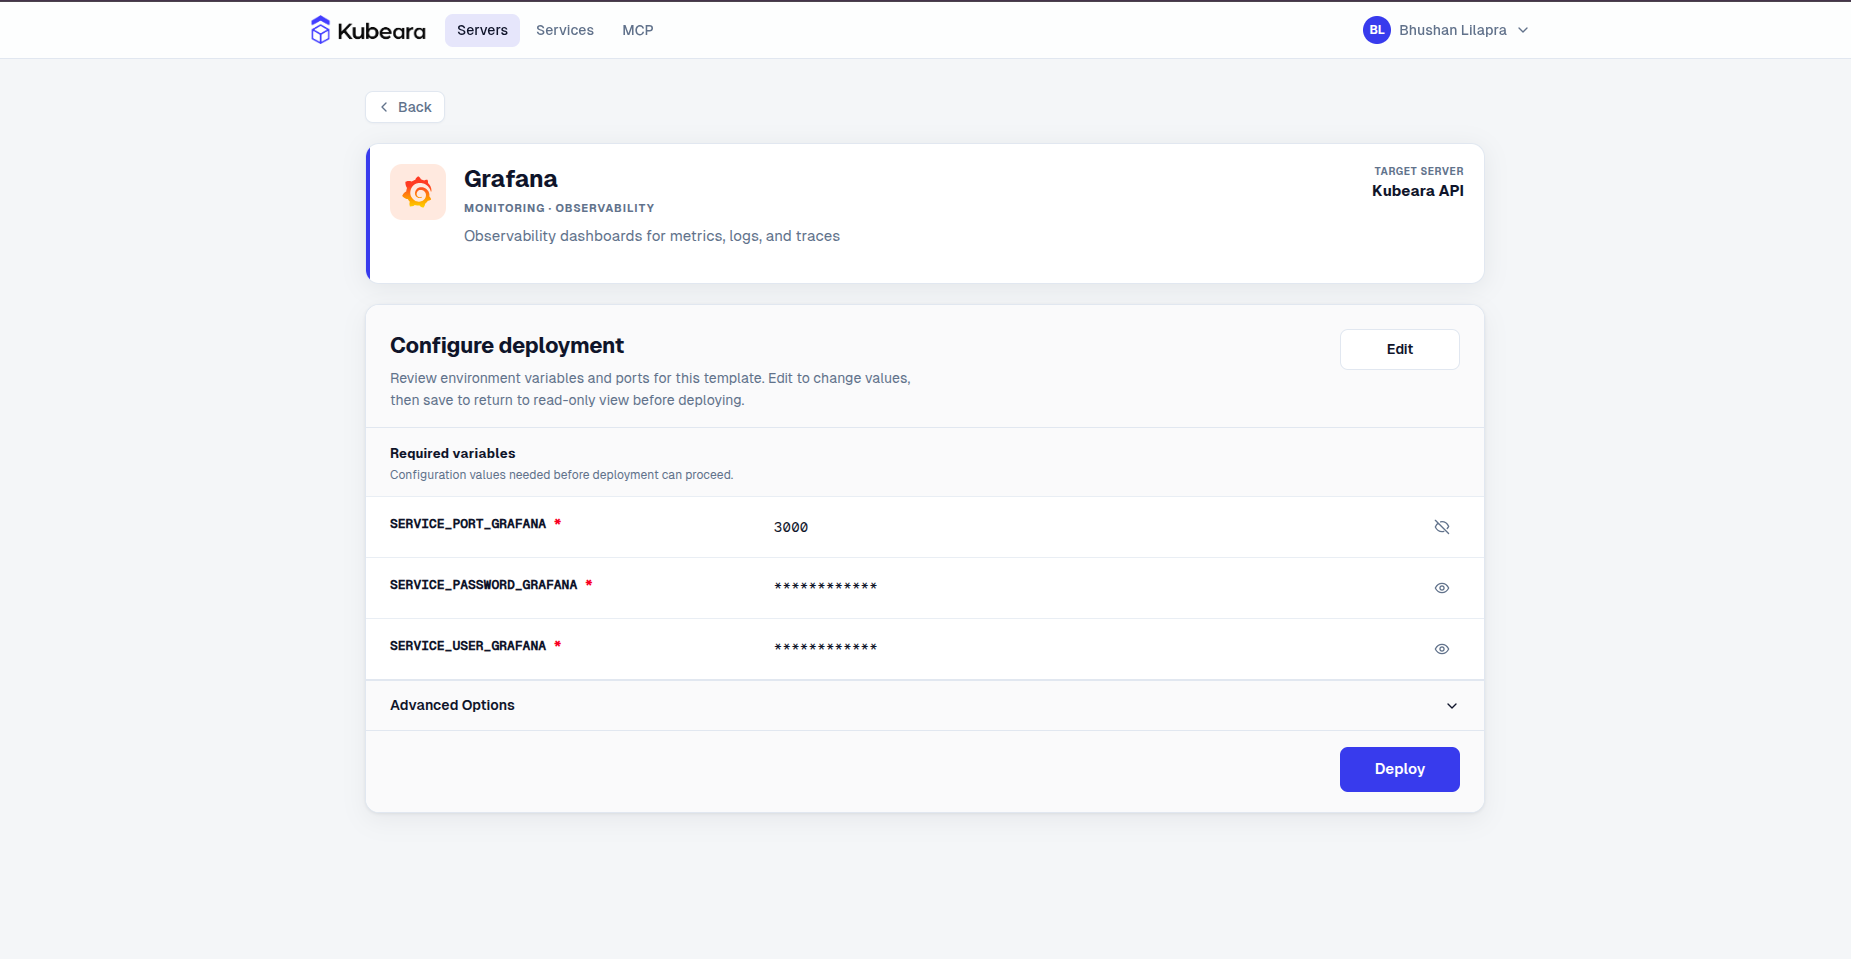
  3. Review the pre-configured settings and click Deploy.

    Grafana environment configuration on Kubeara
    Grafana environment configuration on Kubeara
  4. Grafana is now running on your Kubeara server. Open your dashboard to get started.