
Services

Open-source monitoring and alerting toolkit with time-series metrics

MonitoringMetrics
Deploy

What is Prometheus?

Prometheus is a CNCF open-source systems monitoring and alerting toolkit that scrapes metrics from configured targets, stores them as time series, and evaluates alerting rules. It is widely used for cloud-native observability and is often paired with Grafana for dashboards.
How to deploy on Kubeara

  1. Sign in to your Kubeara dashboard and connect a server if you have not already.

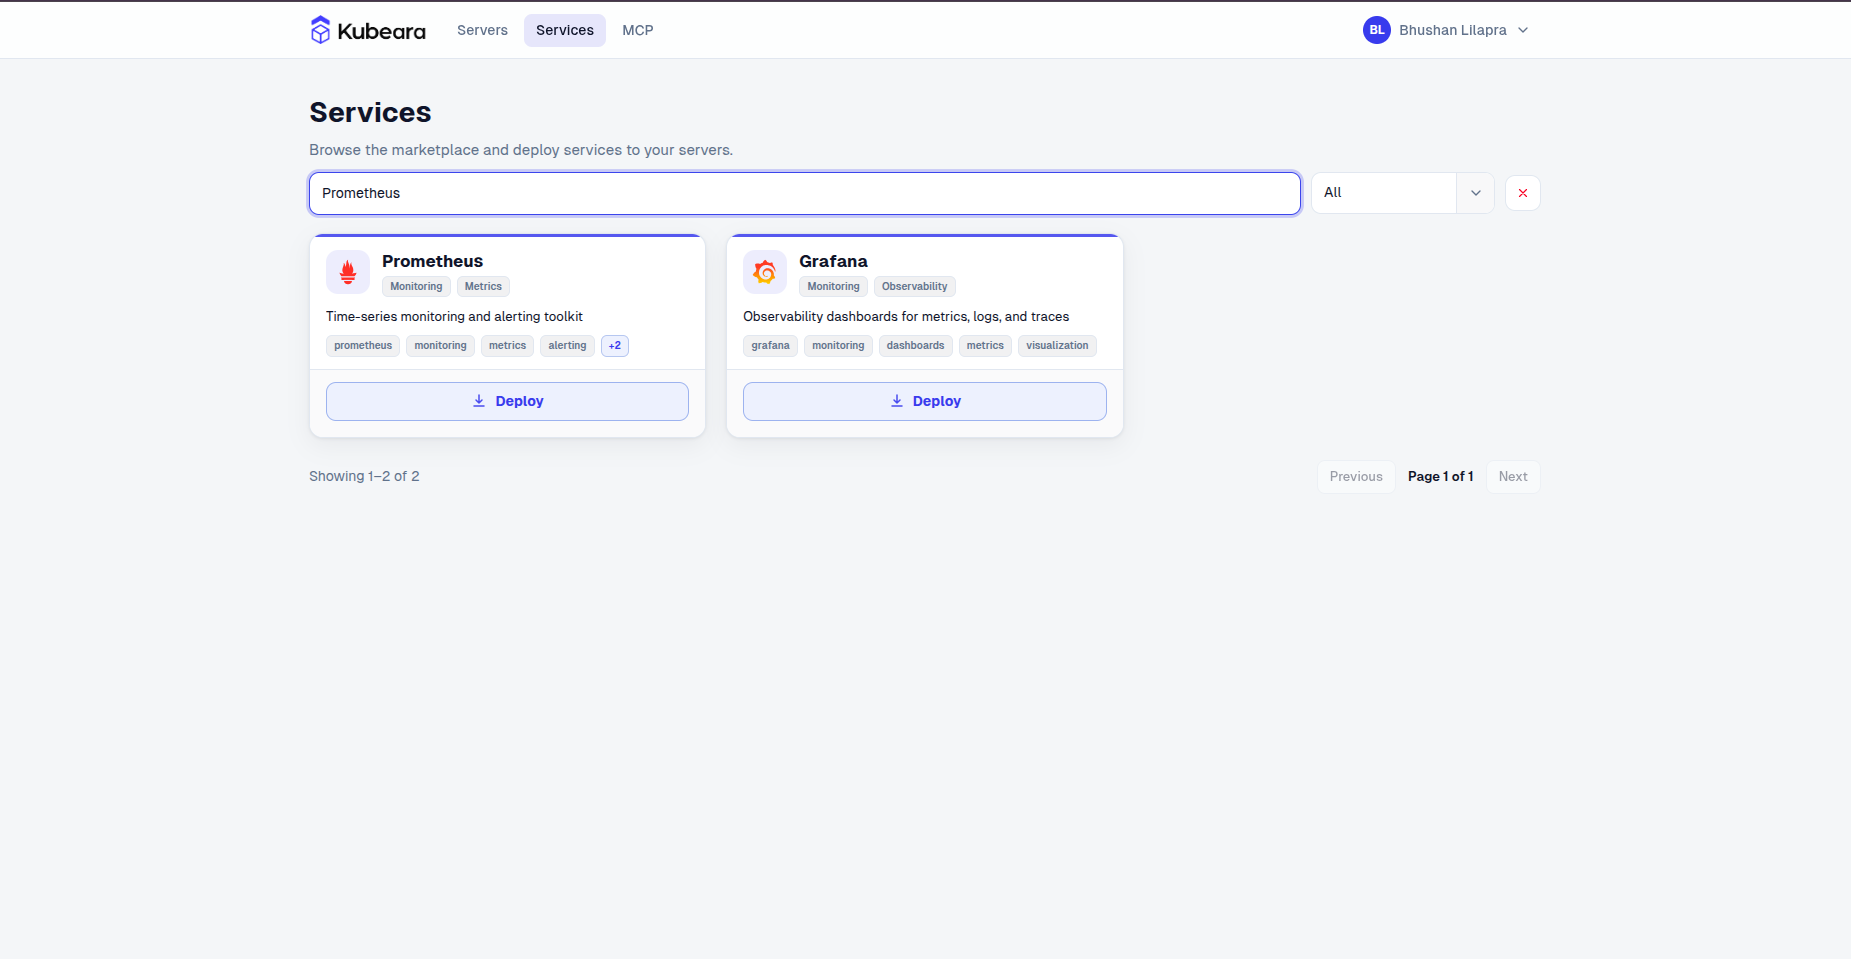
  2. Open the Services catalog and select Prometheus.

    Prometheus on Kubeara
    Prometheus on Kubeara
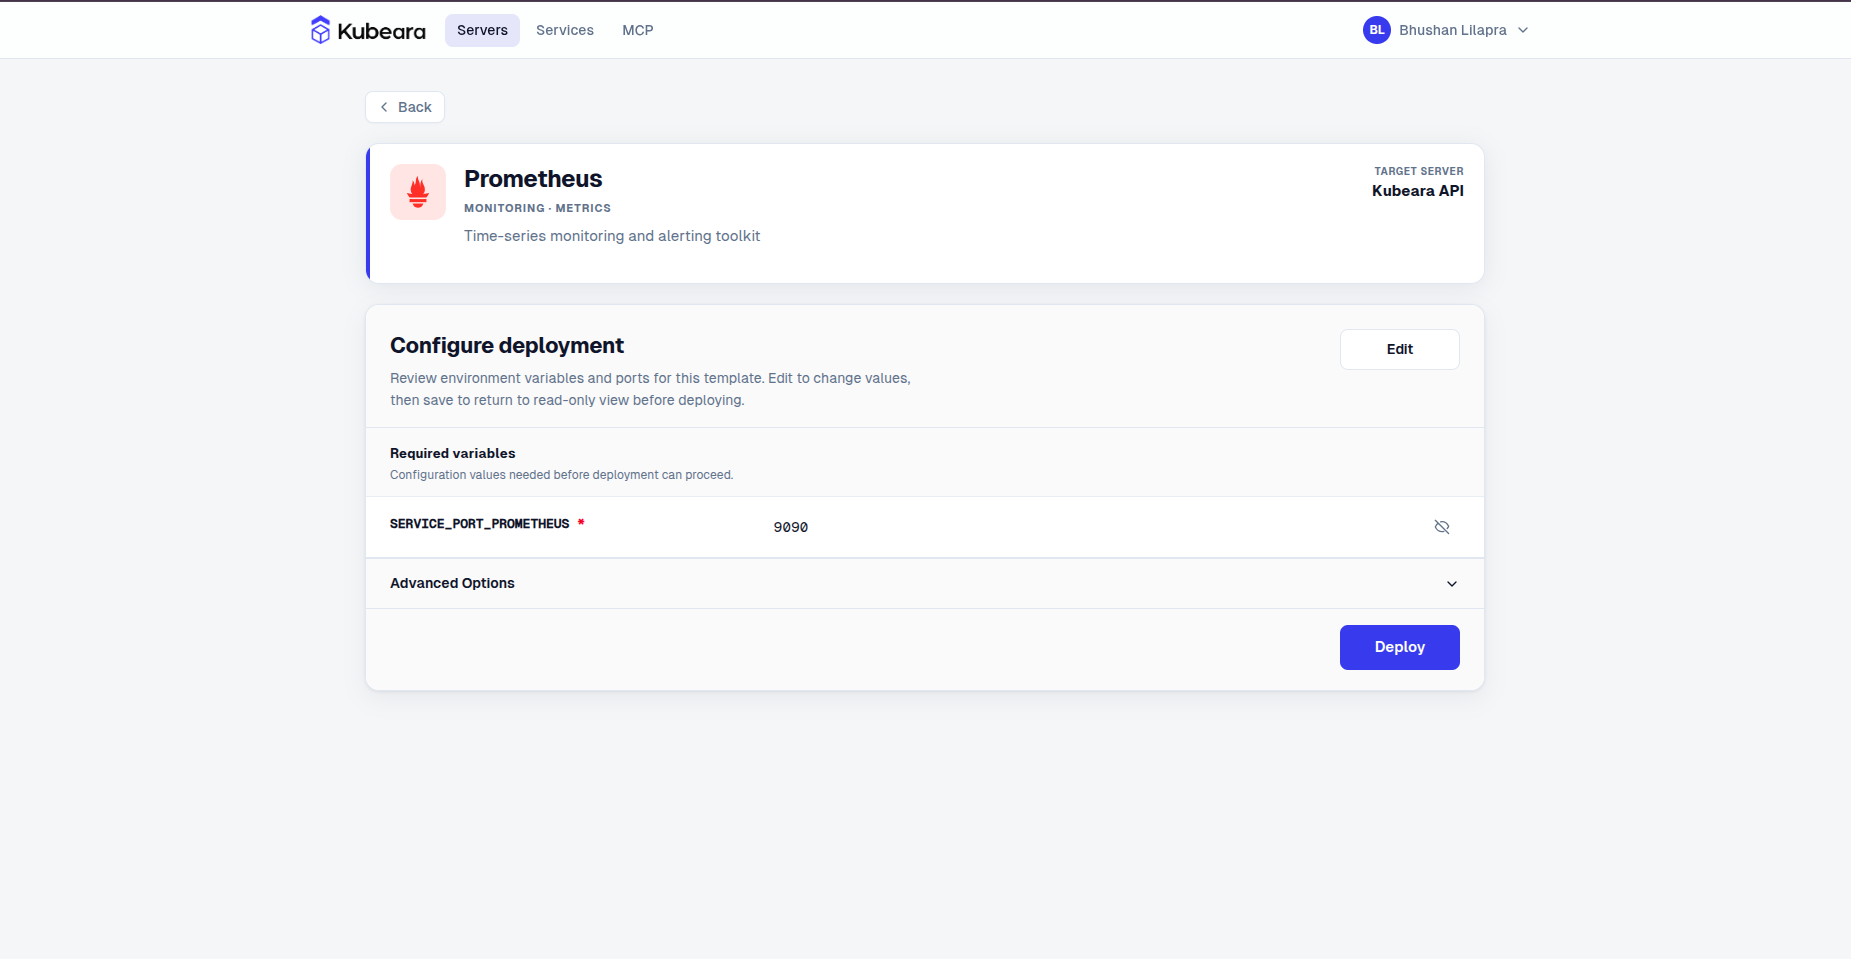
  3. Review the pre-configured settings and click Deploy.

    Prometheus environment configuration on Kubeara
    Prometheus environment configuration on Kubeara
  4. Prometheus is now running on your Kubeara server. Open your dashboard to get started.